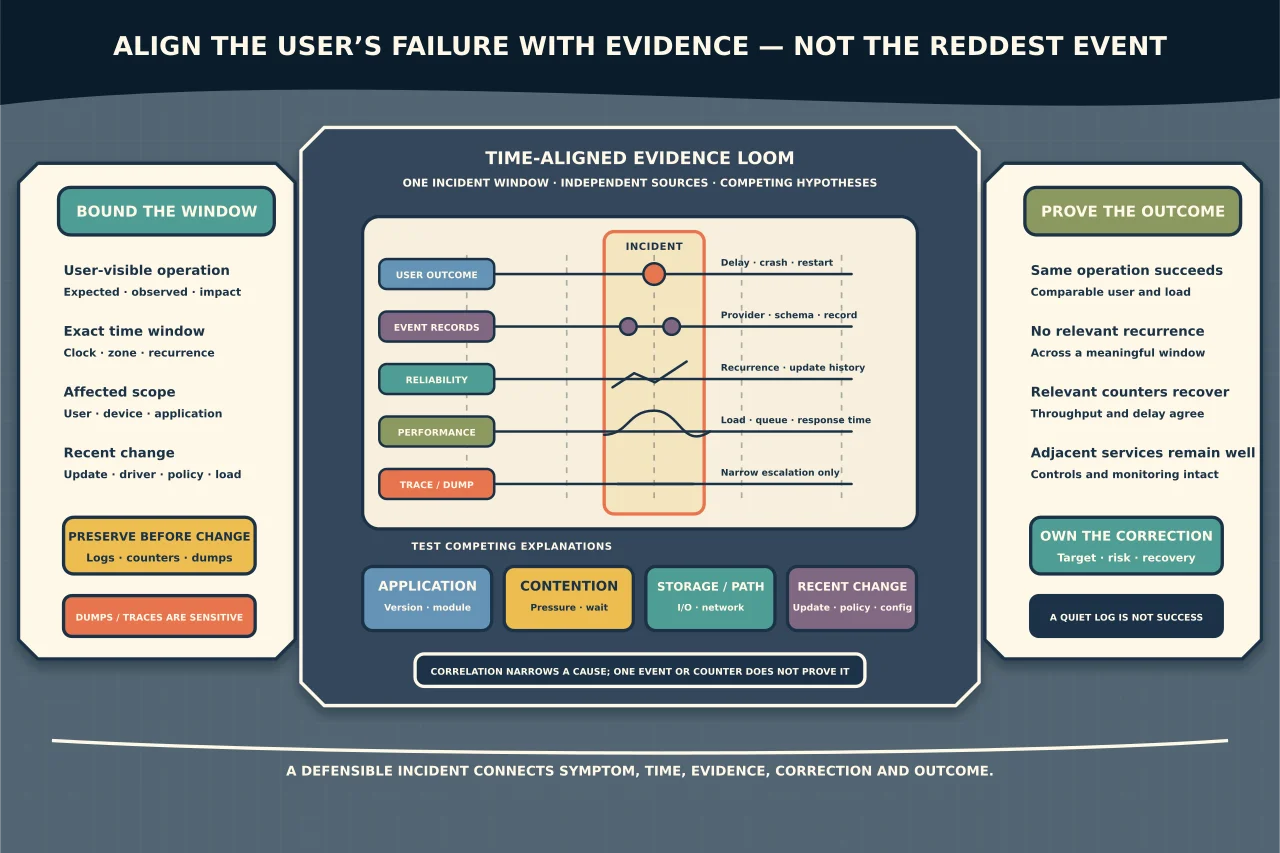
Windows can record thousands of warnings and errors on a healthy computer. The useful question is not “what red events exist?” It is “what changed around the exact time the user-visible operation failed?”
Build a timeline first, then gather the least intrusive evidence that can separate the plausible causes.
Define the incident in user terms
Record:
- exact operation and expected result;
- observed delay, error, hang, crash or restart;
- affected users/devices/applications;
- first and most recent occurrence;
- time zone and clock accuracy;
- reproducible steps or workload pattern;
- recent update, deployment, driver, policy or infrastructure change; and
- business impact and safe observation window.
“Computer slow all day” needs a narrower measurement: perhaps saving one file took 45 seconds between 10:14 and 10:16.
Preserve before-state
Before restarting or clearing anything, capture:
- Windows edition/version/build and uptime;
- application/service/version and process identity;
- current resource snapshot and relevant monitoring;
- Application, System and product-specific events around the time;
- Reliability Monitor entries;
- available application logs, dumps or Windows Error Reporting identifiers; and
- active security/update/backup jobs.
Logs and dumps can contain usernames, document paths, memory contents, tokens and customer data. Keep them in approved storage, restrict access and redact only copies—not the source evidence.
Query by time and provider
Get-WinEvent supports current Event Log and ETW channels. Filter at the source rather than retrieving a whole log and filtering afterward:
$start = Get-Date '2026-01-01T10:00:00'
$end = Get-Date '2026-01-01T10:20:00'

Get-WinEvent -FilterHashtable @{
  LogName = 'Application'
  StartTime = $start
  EndTime = $end
} -MaxEvents 200
Use the actual incident time and explicit time zone. Add ProviderName, Id or named event data only after observing the correct schema. Microsoft notes that FilterHashtable is more efficient for large logs than pulling everything through Where-Object.
Legacy Get-EventLog reads classic logs through a deprecated API. Prefer Get-WinEvent for modern channels and archived .evtx/ETW evidence.
Read event identity correctly
Capture:
- log/channel;
- provider name;
- event ID, version, level and keywords;
- computer and user/security context;
- timestamp and record ID;
- rendered message; and
- XML/EventData fields.
An event ID is namespaced by its provider and schema. “Event 1000” from one provider is not a universal diagnosis. Messages can also fail to render when the provider’s message resource is absent; the XML fields remain important.
Read predecessor and successor events. A service termination may follow an application fault, storage timeout or machine shutdown; the last event is not necessarily the first cause.
Use Reliability Monitor as a navigation aid
Reliability Monitor groups application failures, Windows failures, updates and installations on a timeline. It is useful for spotting recurrence and change correlation. Treat its entries as pointers into the underlying event, crash and update evidence—not as a complete root-cause report.
Match application name/version, fault time, faulting module and problem signature with the user’s incident.
Correlate performance over time
Task Manager is a snapshot. For intermittent problems, Performance Monitor/Data Collector Sets can record counters over the relevant period. Choose counters from the hypothesis rather than collecting everything forever:
- processor and process/thread activity;
- available/committed memory and paging;
- physical/logical disk latency, queue and throughput;
- network interface errors/throughput;
- process handles/threads/private bytes; and
- role/application-specific queues or requests.
Establish normal and incident windows. A counter without workload throughput or user response time can be misleading. High CPU may be productive; low CPU can coexist with storage/network/lock waits.
Set sampling interval, maximum size, retention and stop time so collection cannot fill the system drive. Confirm the collector account and output permissions.
Escalate to ETW only when the question requires it
Windows Performance Recorder captures Event Tracing for Windows data for analysis in Windows Performance Analyzer. It can reveal CPU sampling, disk/file I/O, waits, boot/shutdown and other detailed timelines.
Choose the narrowest WPR profile and duration that can capture the symptom. ETW traces can be large and highly sensitive. Some profiles add overhead; do not leave an unbounded trace running on production.
Record Windows build, WPR/WPA version, profile, start/stop time and reproduction steps. If kernel/application symbols or vendor expertise are required, preserve the trace and escalate rather than guessing at stack names.
Treat crash dumps as sensitive evidence
A crash can produce application dumps, minidumps, kernel dumps or Windows Error Reporting data depending on policy and failure type. Before changing dump settings, confirm:
- which process/system failure is targeted;
- dump type and expected size;
- destination capacity and access control;
- whether memory may contain regulated or secret data;
- retention and secure transfer; and
- who can analyse it.
Do not publish a dump or attach it to an open ticket. A dump’s existence proves a captured failure, not the underlying bug.
Build a hypothesis table
| Hypothesis | Supporting evidence | Contradicting evidence | Next safe observation |
|---|---|---|---|
| Application defect | Same version/module crash signature | Other instances/version unaffected | Vendor known issue/dump analysis |
| Resource contention | User delay aligns with sustained queue/pressure | Resources normal during exact window | Narrow counter/ETW capture |
| Storage/path issue | Disk/file I/O errors and latency align | Only one app fails without I/O effect | Map device/path and app logs |
| Update/config change | Failure begins immediately after recorded change | Same build/config works elsewhere | Compare controlled baseline |
Prefer a hypothesis that explains the timeline across independent sources. Keep alternatives until evidence removes them.
Make the smallest owned correction
The appropriate change might be an application patch, configuration correction, driver/firmware update, capacity action, dependency repair or vendor escalation. It is not automatically “restart and monitor”.
Before change, document target, expected effect, risk, recovery, observation window and owner. Preserve logs/dumps that a restart or reinstall may remove.
Verify the original operation
Repeat the same user workflow under comparable load and confirm:
- response time and outcome;
- event/crash recurrence across a meaningful window;
- relevant counters/queues;
- adjacent applications/services;
- monitoring and alerting; and
- security, backup and update controls.
A quiet Event Viewer is not success, and a successful restart is not root cause. The finished incident record connects user symptom, timeline, evidence, correction and sustained service outcome.