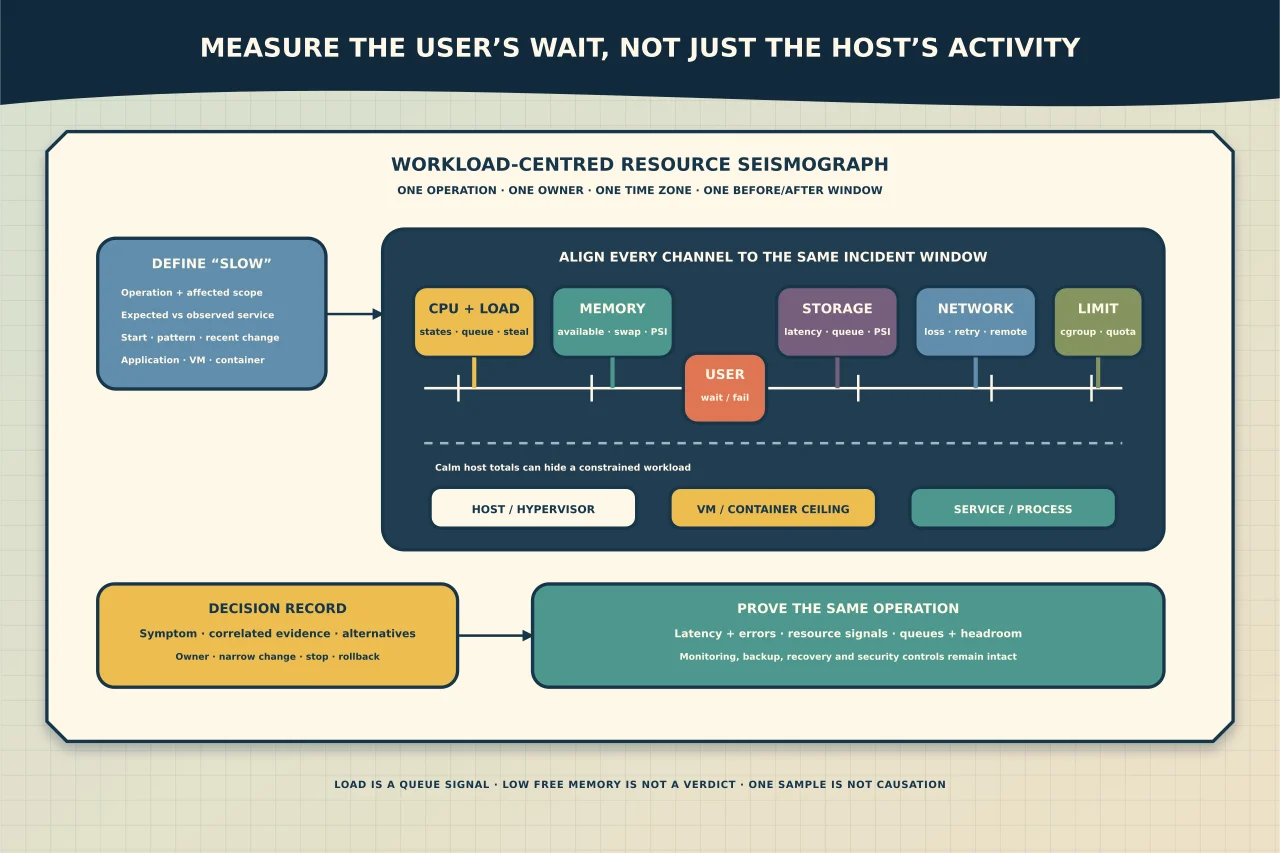
“The server is slow” is a valid user report, but it is not yet a resource diagnosis.
The delay might occur in a browser, DNS lookup, application worker, database lock, filesystem, remote API, network path or an imposed container limit. The host can have spare CPU while one single-threaded worker is saturated, and it can show high load while CPUs wait on storage.
Good performance work connects a user-visible symptom to a time window, workload and constrained resource. Begin with observation; tune only after you can explain the evidence.
Define slow in terms you can measure
Capture:
- what operation is slow or failing;
- who or what is affected;
- when it began and whether it is continuous or periodic;
- expected versus observed response time or throughput;
- the application instance, host, VM or container involved;
- recent deploys, updates, data growth, jobs or infrastructure changes; and
- whether upstream or downstream dependencies are also affected.
Preserve timestamps in one stated time zone. A CPU graph and application log cannot be correlated if their clocks or zones are unclear.
Also identify the success condition. “CPU lower” is not the goal; the original operation should return to an acceptable, explainable service level without moving the problem elsewhere.
Take a small baseline snapshot
These commands are widely available on GNU/Linux systems and read system state:
date --iso-8601=seconds
uptime
free -h
df -hT
vmstat 2 6
They establish time, uptime/load, memory, mounted-filesystem capacity and several short interval samples. Confirm the local command implementations and avoid broad filesystem scans or indefinite monitoring during an incident.
The first vmstat report contains averages since boot; subsequent reports cover each requested interval. That distinction matters. A long-running host can have a calm current interval beside a busy since-boot average.
Load average is not CPU percentage
Linux load average represents the average number of tasks that are runnable or waiting in uninterruptible disk-I/O state over 1, 5 and 15 minutes. It is a queue-like signal, not “percent CPU used”.
Interpret it with:
- the number of CPUs available to the workload, not merely installed on the host;
- the direction across 1, 5 and 15 minutes;
- CPU idle/user/system states;
- runnable and blocked task counts; and
- storage and pressure evidence.
A load of 4 means something different on a one-CPU container and a 32-CPU host. It also matters whether four tasks are computing, waiting for storage or constrained by a cgroup quota.
Do not decide to add CPU from load alone.
Read CPU states as a pattern
vmstat and top expose CPU time in categories such as:
- user (
us) — running non-kernel code; - system (
sy) — running kernel code; - idle (
id) — not busy; - I/O wait (
wa) — idle time while an outstanding I/O is awaited; and - steal (
st) — time a virtual CPU wanted but the hypervisor served another guest.
Sustained high user time with runnable work can indicate compute contention. High system time may point toward kernel, networking, storage or syscall-heavy activity. Steal time matters in virtualised environments. I/O-wait is a clue to inspect storage and workload latency, but it is not a universal percentage of “disk bottleneck”; CPU accounting and parallel work make it context dependent.
When one process appears busy, confirm the process, threads, service ownership and operation. A process can be the victim of a dependency rather than the cause. Never kill the top row merely because it is at the top.
Low free memory is not automatically a memory shortage
Linux uses otherwise idle RAM for caches. MemFree alone therefore understates memory that can become available to applications. The kernel’s MemAvailable estimate—and the available field shown by current free—accounts for reclaimable cache and the fact that not all cache can be reclaimed safely.
Look for a pattern:
- available memory falling during the incident;
- active swap-in/swap-out, not simply non-zero swap use;
- major faults and reclaim activity;
- growing anonymous memory or one workload’s resident set;
- out-of-memory or allocation-failure messages;
- memory Pressure Stall Information; and
- an imposed memory limit below host capacity.
Historical swap use can remain after pressure has passed. Cached memory can be useful. Dropping caches to make a dashboard look “free” discards useful state, can increase I/O and does not fix the workload’s allocation behaviour.
Pressure Stall Information adds “are tasks waiting?”
On kernels that expose it, PSI reports CPU, memory and I/O pressure through /proc/pressure/:
cat /proc/pressure/cpu
cat /proc/pressure/memory
cat /proc/pressure/io
The some line represents time when at least some tasks are stalled on that resource. full represents time when all non-idle tasks in scope are stalled simultaneously; CPU pressure does not provide a full line because at least one task is using the CPU.
PSI helps distinguish resource occupancy from workload delay. It still needs correlation with the affected service and time window. A brief system-wide stall may not explain a persistent latency problem in one tenant, while cgroup-scoped pressure may reveal a limit hidden by calm host totals.
Separate capacity, throughput and latency for storage
A filesystem can have free space and still be slow. Conversely, a full filesystem may be the consequence of a runaway job rather than the cause of earlier latency.
Inspect:
- filesystem block and inode capacity;
- blocked tasks and I/O pressure;
- read/write throughput and operations;
- latency, queue depth and device utilisation from the available storage tooling;
- application fsync, lock, checkpoint or database evidence;
- guest-versus-host and logical-versus-physical storage layers; and
- snapshots, replication, rebuilds, backups or competing workloads.
Do not interpret device “100% utilisation” without the device model and latency. A modern parallel device can remain busy while meeting its latency target; a network filesystem can stall on a remote server while the local block device is quiet.
Include the network and dependencies
If CPU, memory and local I/O look healthy, follow the transaction outward:
- name resolution and connection establishment;
- packet loss, retransmissions, errors and drops;
- link speed/duplex or virtual-interface state;
- firewall, proxy and load-balancer timing;
- database, directory, API and storage dependencies; and
- provider or remote-service telemetry.
Ping latency alone does not prove that the application protocol, request path or backend is healthy. Measure the same operation the user performs, from the relevant location, without publishing secrets or personal data.
Hosts, VMs, containers and services have different ceilings
A healthy host-wide total can hide a constrained workload. Check whether the process belongs to a systemd service, slice, scope, container or orchestrator group and whether it has CPU, memory or I/O limits.
On suitable systemd systems, systemd-cgtop can show resource use by control group. Visibility depends on enabled accounting and cgroup controllers. Container tools may expose a namespace-relative CPU count or memory limit, while the host exposes the physical total.
In virtual machines, include hypervisor CPU ready/steal, host storage latency, memory ballooning and the guest’s own counters. Neither layer alone tells the whole story.
Correlate application evidence
System counters become useful when they align with service evidence:
- request latency and error rate;
- queue depth and worker saturation;
- database waits, locks and slow operations;
- garbage collection or runtime pauses;
- timeouts to named dependencies;
- service restarts, OOM events or kernel errors; and
- scheduled jobs, backup windows and deployments.
Protect sensitive log content. Query the smallest relevant time window, redact identities and tokens, and preserve original evidence under the organisation’s access and retention controls.
Use a decision record before changing anything
For each proposed correction, state:
- the observed symptom and affected workload;
- the correlated counters and logs;
- the hypothesised constraint;
- evidence that contradicts plausible alternatives;
- the narrow change and owner;
- expected user-facing result;
- monitoring and stop conditions; and
- recovery or rollback path.
Examples might include fixing an application query, rescheduling a competing job, repairing storage, correcting a cgroup limit or adding capacity. The evidence should choose the action; the article cannot choose it in advance.
Verify the service, not just the graph
After an approved change, repeat the same user operation and observation window. Confirm:
- response time, throughput and error rate;
- CPU, memory, I/O, network and pressure signals;
- expected queues and resource headroom;
- no new kernel, service or application errors;
- monitoring/alerting still sees the workload; and
- backup, recovery and security controls remain intact.
A restart that temporarily clears a queue is useful evidence, not a root-cause explanation. Keep the timeline, before/after measurements and unresolved questions so the next recurrence begins with knowledge rather than folklore.