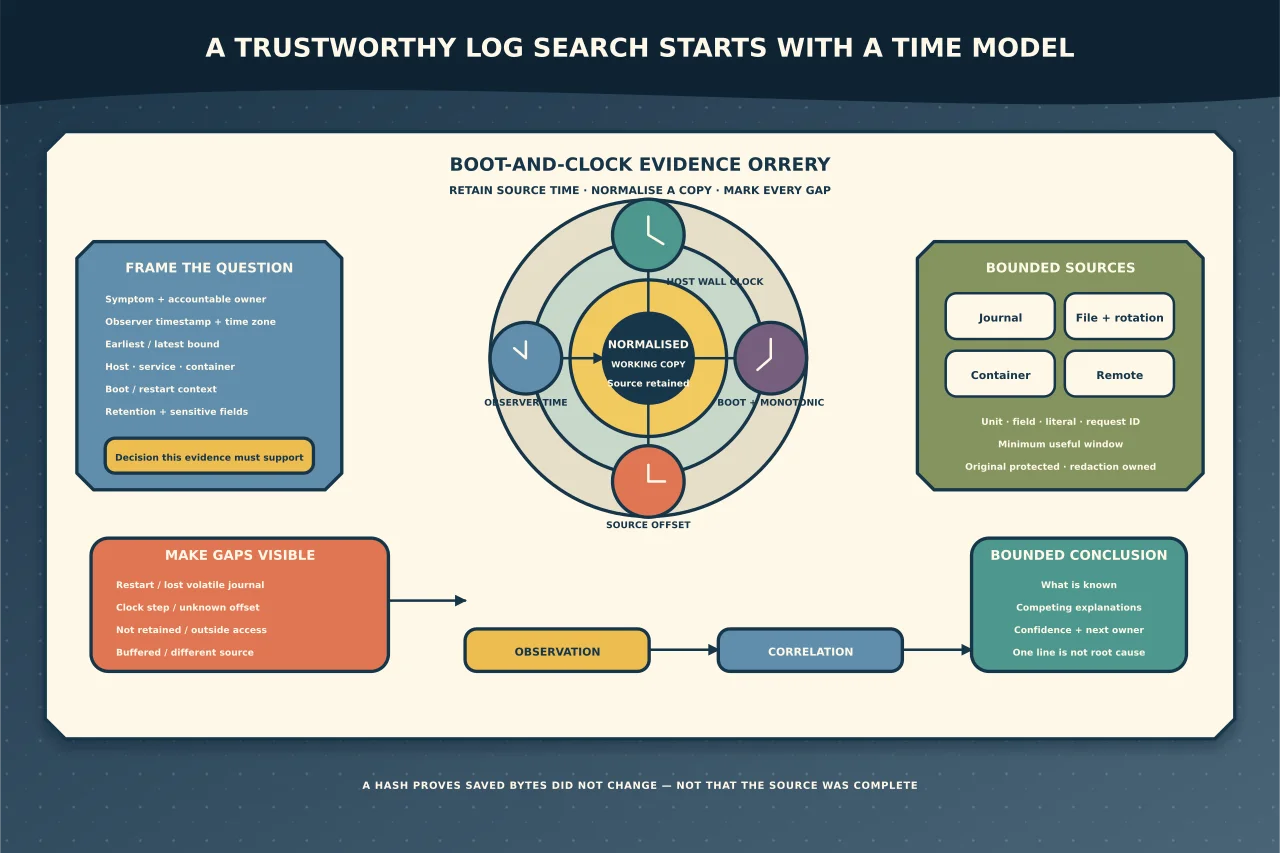
“Search the logs around 10:30” sounds precise until you discover that the ticket uses local time, the server displays UTC, the VM clock stepped, the service runs in a container and the relevant boot’s volatile journal disappeared at restart.
A trustworthy search starts with a time model, not a keyword.
Frame the question
Write down:
- system/workload and accountable owner;
- reported symptom and who observed it;
- observer’s timestamp with time zone;
- host/container/service believed relevant;
- earliest/latest search bounds;
- current boot and whether a restart occurred;
- expected log sources/retention/forwarding;
- sensitive fields likely to appear; and
- the decision the evidence must support.
If the user says “10:30”, ask whether that was their local time, the application’s displayed time or a timestamp copied from a message. Convert once and retain the original.
Establish clock and boot context
Before interpreting sequence, capture the host’s current time, time zone and clock-synchronisation state using the platform’s supported read-only tools. Record relevant boot boundaries and recent time adjustments where available.
Wall-clock time can jump because of synchronisation, manual change, suspend/resume or virtualisation. A monotonic timestamp progresses relative to a boot and is valuable for within-boot order, but cannot by itself map across boots or hosts. Preserve both when the source offers them.
For multi-system correlation, normalise a copy of results to UTC while retaining source timestamps and offsets. Never silently relabel a local timestamp as UTC.
Identify the source before searching
Possible sources include:
- systemd journal;
- application-specific files;
- kernel/audit/security logs;
- reverse proxy/database/queue logs;
- container or orchestrator logs;
- remote collectors/SIEM; and
- cloud/service-provider logs.
Confirm which layer actually records the event. A systemd service may write structured journal fields, its own file, both or neither. A container’s stdout may be held by its runtime rather than the host unit you first search.
Record retention and rotation. Missing evidence can mean “not emitted”, “not retained”, “outside permissions”, “different host/source” or “search was wrong”—not necessarily “it did not happen”.
Use bounded journal queries
Start broad enough to catch the failure family, but bound the boot and time. Illustrative read-only patterns:
journalctl --list-boots
journalctl --boot 0 --unit '<service>.service' \
  --since 'YYYY-MM-DD HH:MM:SS UTC' \
  --until 'YYYY-MM-DD HH:MM:SS UTC' \
  --utc --output=short-iso-precise --no-pager
Then add one filter at a time: unit, priority, kernel transport, executable, PID or structured field. Inspect verbose/JSON output for selected entries when you need metadata hidden by the one-line display.
journalctl --boot 0 --since '<start>' --until '<end>' \
  --output=verbose --no-pager
--since and --until accept systemd time syntax; timestamps without an explicit zone use local time. Use an unambiguous full date and zone in saved procedures. Confirm your installed systemd version supports any chosen output/filter option.
Do not begin with an unbounded journalctl | grep error. It mixes boots/sources, can expose far more data than needed and discards structured context.
Search file logs without changing them
First inventory the exact files, rotations, compression and metadata. Search a read-only copy when incident policy requires preservation.
Use fixed-string search when the token should be literal:
grep --fixed-strings --line-number --context=3 -- '<literal token>' '<log-file>'Use a regular expression only when its pattern is intentional and reviewed. Quote patterns/paths, use -- before values that could begin with a dash, and record case sensitivity. Compressed rotations need an appropriate read-only viewer/search tool; do not decompress over originals.
Searching for failed finds text, not a semantic failure. Applications may log success at one layer and fail at the next. Search stable correlation values—request ID, transaction ID, job ID, process plus time—while treating identifiers as sensitive.
Understand file timestamps
On typical Linux/POSIX filesystems:
- mtime: file content modification time;
- ctime: inode-status change time, such as permissions/ownership and also content changes—not creation time;
- atime: last access, subject to mount/update behaviour; and
- birth time: creation time only where filesystem/kernel/tool support exposes it.
Use stat to inspect the exact file. Do not infer “log entry written at X” from a log file’s mtime: it normally describes the latest content modification to the file, not every line. Rotation, copy, restore and extraction can change or preserve metadata in ways that break naive timelines.
Accessing files may update atime depending on mount policy, so coordinate with formal forensics rather than improvising on original evidence.
Preserve a minimal evidence slice
For an operational investigation, record:
- host/source and collection identity;
- command/query and installed tool version;
- start/end time and time zone;
- boot/unit/container identifiers where relevant;
- original log location and retention notes;
- protected output file, size and hash where appropriate;
- redactions and who can access the unredacted source; and
- known gaps/clock uncertainty.
Hashing demonstrates whether the saved bytes later changed; it does not prove the source was complete, authentic or collected under a legally sufficient process.
Do not paste tokens, session cookies, email content, personal details or customer payloads into tickets/chat. Redact the working excerpt while retaining the controlled original only when authorised and necessary.
Correlate before concluding
Build a small timeline:
| Time/zone | Host/source | Observation | Correlation | Confidence/gap |
|---|---|---|---|---|
| exact source time | user/client | symptom observed | request or job | observer clock unknown? |
| normalised time | service | request accepted | same identifier | buffered? |
| normalised time | dependency | timeout/denial | address/transaction | remote clock offset? |
| normalised time | service | user-facing failure | same request | complete path? |
Use a line as evidence that a component emitted that record. Do not convert it automatically into “root cause”. Seek corroboration across the request path and compare a healthy period where useful.
Report what is known—and what is not
A useful conclusion says:
- the bounded question and time conversion;
- sources searched and access/retention limits;
- observations with exact references;
- correlations that support the sequence;
- competing explanations;
- gaps that prevent certainty; and
- the next safe test or owner decision.
Never clear, truncate or vacuum logs to “make diagnosis easier”. Capacity/retention changes are separate controlled work. The objective is a reproducible evidence path, not the largest possible log dump or the most confident-sounding story.