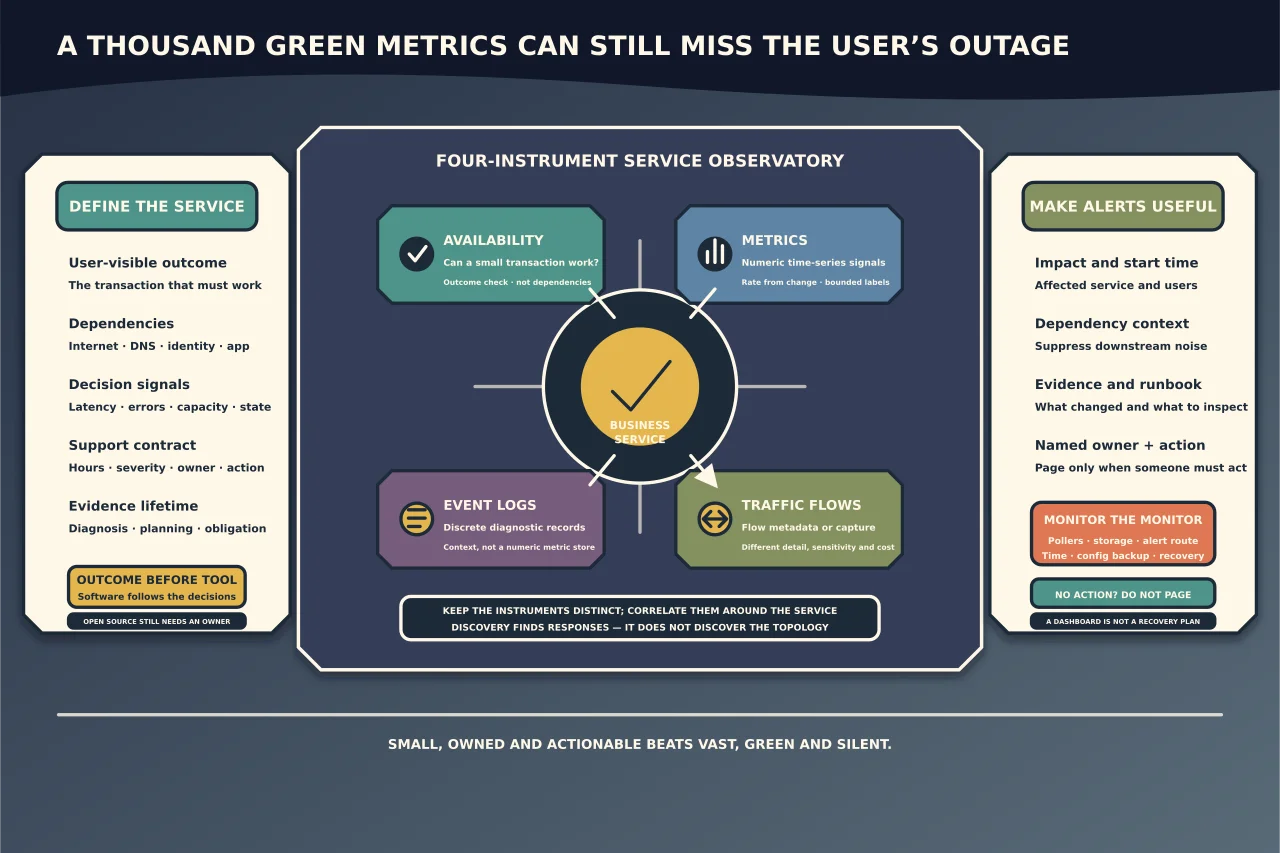
A monitoring server that collects thousands of green metrics can still miss the outage a user cares about. Begin with services, decisions and owners—not software installation.
Define what must be known
For each business service, record:
- who uses it and what “available” means;
- dependencies such as internet, DNS, identity, firewall and application;
- useful latency/error/capacity indicators;
- support hours and severity;
- notification owner and expected action; and
- retention needed for diagnosis and planning.
Distinguish four evidence types:
- availability checks ask whether a service can perform a small transaction;
- metrics are numeric time series such as latency, errors, utilisation and interface counters;
- logs are discrete event records with diagnostic context; and
- flow/capture data describes network conversations at different levels of detail.
No single open-source product must own all four. Prometheus explicitly describes itself as a numeric time-series system, not an event-log or billing-grade transaction store.
Choose an operating model
Prometheus commonly scrapes HTTP metric endpoints and exporters, evaluates rules and sends alerts to Alertmanager. It is strong for dimensional service/host metrics and dynamic targets.
Zabbix combines agent, service, SNMP and other checks with templates, discovery, triggers, history, dashboards and notifications. Its current documentation states that network discovery finds hosts/services; it does not discover topology.
Choose based on the estate and skills, not fashion. A small mixed network may value integrated SNMP and templates. An instrumented application environment may fit Prometheus. Running both can be valid when responsibilities are clear, but duplicating every poll/alert creates burden.
Place monitoring outside the failure it observes
If the monitor, DNS, notification relay and target share one host, link or power source, one failure can silence all evidence. Use independent external checks for public/user paths and internal checks for component detail. Monitor the monitoring server, pollers/proxies, storage and notification route.
Synchronise time. Back up configuration, rules, dashboards, credentials metadata and any history required for obligations. Test restoration—graphs are not a configuration backup.
Inventory deliberately
Start from an approved asset/subnet list. Automated discovery can accelerate onboarding but can also create duplicate hosts, probe sensitive ranges or attach a template to the wrong device. Zabbix discovery actions are event-driven; constrain them so “down/lost” events do not trigger inappropriate host creation or remote actions.
Identify devices by durable evidence such as asset ID, serial or managed identity rather than reverse DNS alone. IP addresses move. Treat unknown discovered devices as review items, not automatically trusted monitoring targets.
Collect the minimum useful telemetry
For network devices, high-capacity interface counters, errors/discards, operational status, CPU/memory, environmental sensors and neighbour/routing health may be useful. Calculate traffic rate from counter change over time; a raw octet counter is not current bandwidth. Account for counter reset/wrap and interface replacement.
Prefer SNMPv3 with authenticated/encrypted access where supported and use a least-privileged monitoring identity. Restrict sources at the device and network. Never embed community strings or credentials in public templates or scripts.
For Prometheus, review each exporter as software with its own maintenance and exposure. The project notes that third-party exporters are not all vetted. Restrict metric endpoints: labels and process/application metrics can reveal internal names, paths and customer context.
Control label cardinality and polling frequency. Per-user, request-ID or unbounded address labels can overwhelm storage. A one-second poll of thousands of interfaces may harm devices and provide no actionable value.
Alert on impact and action
Prometheus guidance recommends few alerts, focused on user-visible symptoms, with consoles for causes and no page when there is nothing to do.
Every notification should say:
- affected service/site and observed symptom;
- start time and duration/debounce;
- severity and user impact;
- related dependency state;
- evidence/dashboard and runbook;
- current owner and escalation; and
- whether the condition is still active.
Group related alerts and inhibit downstream noise when a known dependency fails. A failed site link should not page separately for every printer behind it. Use warning/ticket channels for capacity trends and paging for urgent actionable impact.
Test notification delivery end to end, including the “monitor cannot send” case. A green dashboard nobody sees is not an alerting system.
Baseline before choosing thresholds
Collect representative business cycles, then set thresholds around service objectives and capacity lead time. Interface utilisation alone can mislead: microbursts, errors, latency and queue drops may affect users below an averaged bandwidth threshold.
Use maintenance windows with ownership and expiry. Avoid permanent silences. Track configuration changes so a missing alert can be distinguished from a fixed system.
Validate with controlled failures
Disconnect a synthetic target, stop a test exporter/service, delay a response, break notification delivery and exhaust test capacity. Confirm detection time, grouping, escalation, recovery notification and evidence retained for diagnosis. Test monitoring-system backup and rebuild.
Review monthly: noisy alerts, unactioned warnings, undiscovered assets, stale targets, unsupported exporters/templates, failed backups, expiring credentials and capacity forecasts. Remove metrics that drive no decision.
Open source removes licence barriers, not ownership. A small system with clear outcomes, secure collection, tested alerts and a named operator is more valuable than a vast dashboard estate that quietly depends on hope.