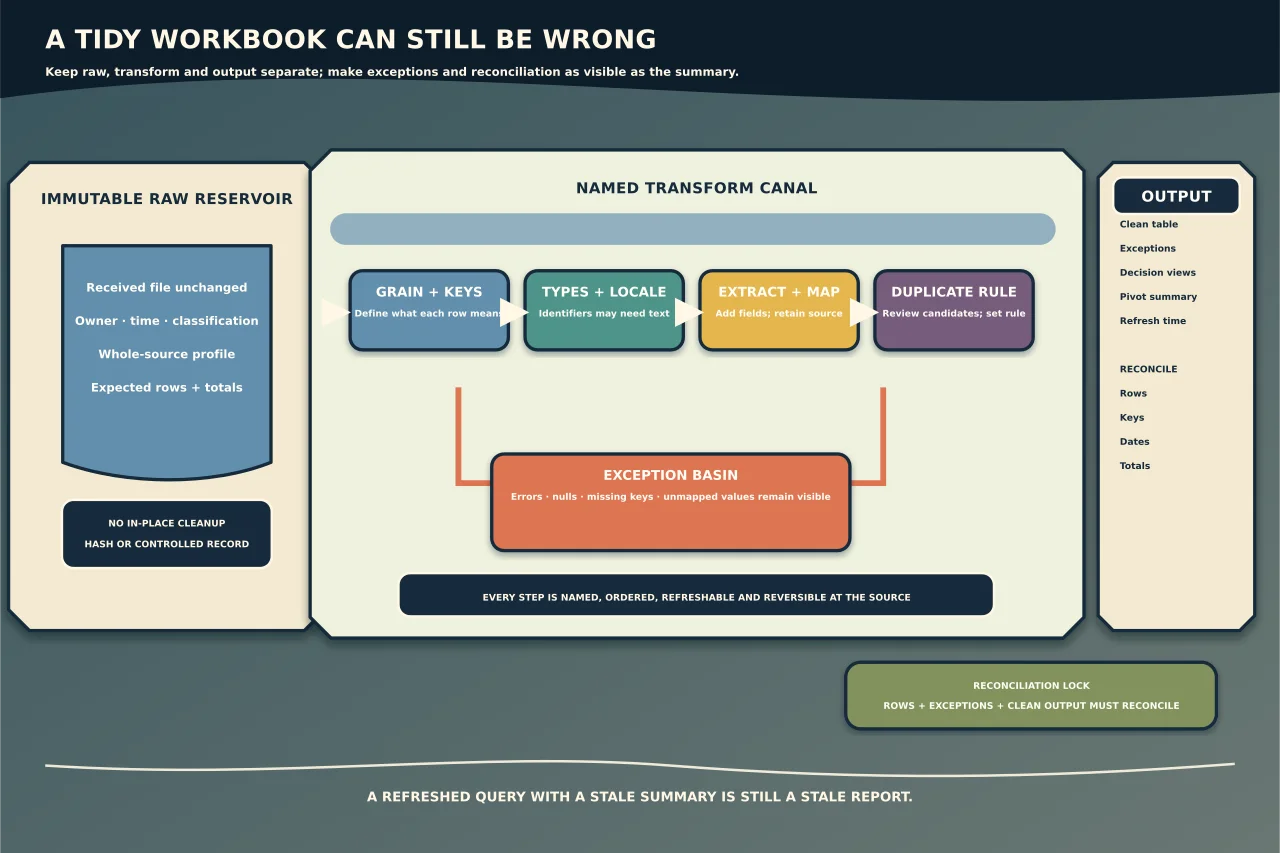
A spreadsheet can look tidy and still be wrong. Dates may be text, identifiers may have lost leading zeroes, one record may be spread across several rows and a “Remove Duplicates” click may have deleted legitimate transactions.
The safest workflow has three visible layers:
- Raw: an unchanged copy of what arrived.
- Transform: recorded, refreshable cleanup steps.
- Output: a table, PivotTable or report built from the transformed data.
That separation lets you correct a rule and refresh instead of repeating manual edits from memory.
Write down the question before touching the data
Define the output in one sentence: for example, “monthly ticket count and median resolution time by team” or “one row per device with its latest observed owner”. Then record:
- source, extraction time and accountable owner;
- privacy/sensitivity and permitted destination;
- what one input row represents—the grain;
- fields that identify a row or entity;
- required output fields, groupings and calculations;
- expected row count, date range and control totals; and
- refresh frequency and known late/corrected records.
If you cannot explain what a row represents, you cannot safely deduplicate or aggregate it.
Preserve the raw source
Keep the received file unchanged and work from a copy or Power Query connection. Record its name, size, modified/extraction time and, for a controlled workflow, a hash. Restrict access and sharing to the data’s classification.
Do not “clean” the source tab by deleting headers, filling blanks or converting values in place. Those changes destroy evidence about what arrived and make refreshes difficult to reproduce.
Profile before transforming
Inspect the whole dataset—not only the first screenful—for:
- multiple header/title rows, merged cells and subtotals;
- blank rows/columns and trailing notes;
- mixed date, decimal and thousands-separator conventions;
- identifiers interpreted as numbers or scientific notation;
- mixed data types in one column;
- leading/trailing/non-printing spaces;
- errors, nulls, placeholders such as
N/A, and zeros; - duplicate-looking rows and repeated legitimate events;
- formulas versus stored values; and
- several entities packed into one cell or spread across columns.
Create a small data dictionary: field name, meaning, expected type, allowed blanks, examples, sensitivity and source. This exposes ambiguity before it becomes a formula.
Decide the grain and keys
Suppose two rows share a customer name. They might be duplicates—or two orders. A useful key may be order number; a device record may need tenant plus device ID; a daily measurement may need sensor plus timestamp.
Classify:
- entity key: identifies the customer, device or item;
- event key: identifies a transaction or observation;
- version/order field: decides which of several observations is current; and
- reference fields: useful descriptions, not safe keys.
Never deduplicate on a convenient display name unless the business owner confirms that it is unique and stable.
Build a repeatable Power Query flow
In Excel, load the copy through Data > Get Data or From Table/Range, then keep steps small and named clearly. A typical sequence is:
- select the intended sheet/table and remove only known title/footer rows;
- promote the correct header row;
- retain/rename required columns;
- explicitly assign data types and locale;
- trim/clean text while preserving meaningful punctuation/zeroes;
- split or extract structured fields into new columns;
- standardise controlled categories through an explicit mapping table;
- flag parse errors, unknown values and missing keys;
- apply a documented duplicate rule; and
- load a clean table plus a separate exceptions table.
Microsoft notes that automatic type detection on unstructured sources is inferred from sampled values. Review it. Telephone numbers, asset codes, postcodes and long IDs are usually text even when they contain only digits. A locale mismatch can reverse day/month interpretation or decimal separators.
Prefer adding a parsed column before removing the original. If a field contains Surname, Given name, split a copy and retain the source value until reconciliation. If delimiters are inconsistent or names have real-world exceptions, flag them for review instead of inventing certainty.
Treat blanks, zeroes and errors as different states
Do not casually replace all of them with zero:
- blank/null may mean not supplied, not applicable or not yet observed;
- zero is a recorded numeric value;
- an error means a transformation failed; and
- a placeholder is source text whose meaning must be agreed.
Add an exception reason such as Missing key, Invalid date or Unmapped category. Count exceptions and keep them in the output pack. Quietly filtering them out makes the report look better by making it less complete.
Deduplicate with a declared rule
Power Query removes duplicates according to the comparison columns selected. Before doing so, produce a duplicate-candidate view and answer:
- Which fields define sameness?
- Are repeated events legitimate?
- If records differ, which survives and why?
- Must values be merged rather than one row discarded?
- Is the rule deterministic after refresh?
For “latest device observation”, the rule might be: sort by a trustworthy captured timestamp and stable tie-breaker, group by tenant/device ID, keep the latest, and retain a history count. For transactions, removal may be wrong even when every visible value matches.
Record input rows, duplicate candidates, removed/consolidated rows and output rows. The arithmetic must reconcile.
Summarise only the clean table
Use one header row, one field per column and consistent types. Convert the output to an Excel Table, then create a PivotTable from it.
Check the Values area deliberately. If Excel interprets a numeric field as text, a PivotTable may count it instead of summing it. Set the intended aggregation—count, distinct count where supported, sum, average, minimum or maximum—and apply the correct number format.
Name the measure honestly: “rows”, “distinct tickets” and “customers” are different. Refresh the query and PivotTable together; a refreshed query with a stale PivotTable is still a stale report.
Reconcile the result
Before release, compare:
| Control | What to prove |
|---|---|
| Row bridge | input = excluded + exceptions + consolidated/removed + clean output, according to the declared rule |
| Keys | required keys are populated and unique at the output grain |
| Date range | earliest/latest and period counts match expectation |
| Totals | independent control totals agree, with rounding policy stated |
| Categories | all values are mapped or visible as exceptions |
| Samples | representative records trace from raw source through output |
| Refresh | replacing the source with a controlled new extract reproduces the steps |
A difference is not automatically a Power Query bug. It may reveal a source correction, changed export shape, late record or wrong business rule. Investigate and record it.
Publish an audit-friendly output pack
Include:
- the unchanged restricted raw source or a reference to its controlled location;
- transformed table;
- exceptions and duplicate-decision views;
- query refresh time/status;
- data dictionary and transformation notes;
- reconciliation controls; and
- PivotTable/report with clearly defined measures.
Remove or aggregate personal/confidential fields that the audience does not need. A clean workbook should be understandable without relying on the person who cleaned it remembering what they clicked.